Hi,
I am working as a freelance compositor on Nuke and Flame. I am often working for INFECTED.digital in Hamburg, Germany.
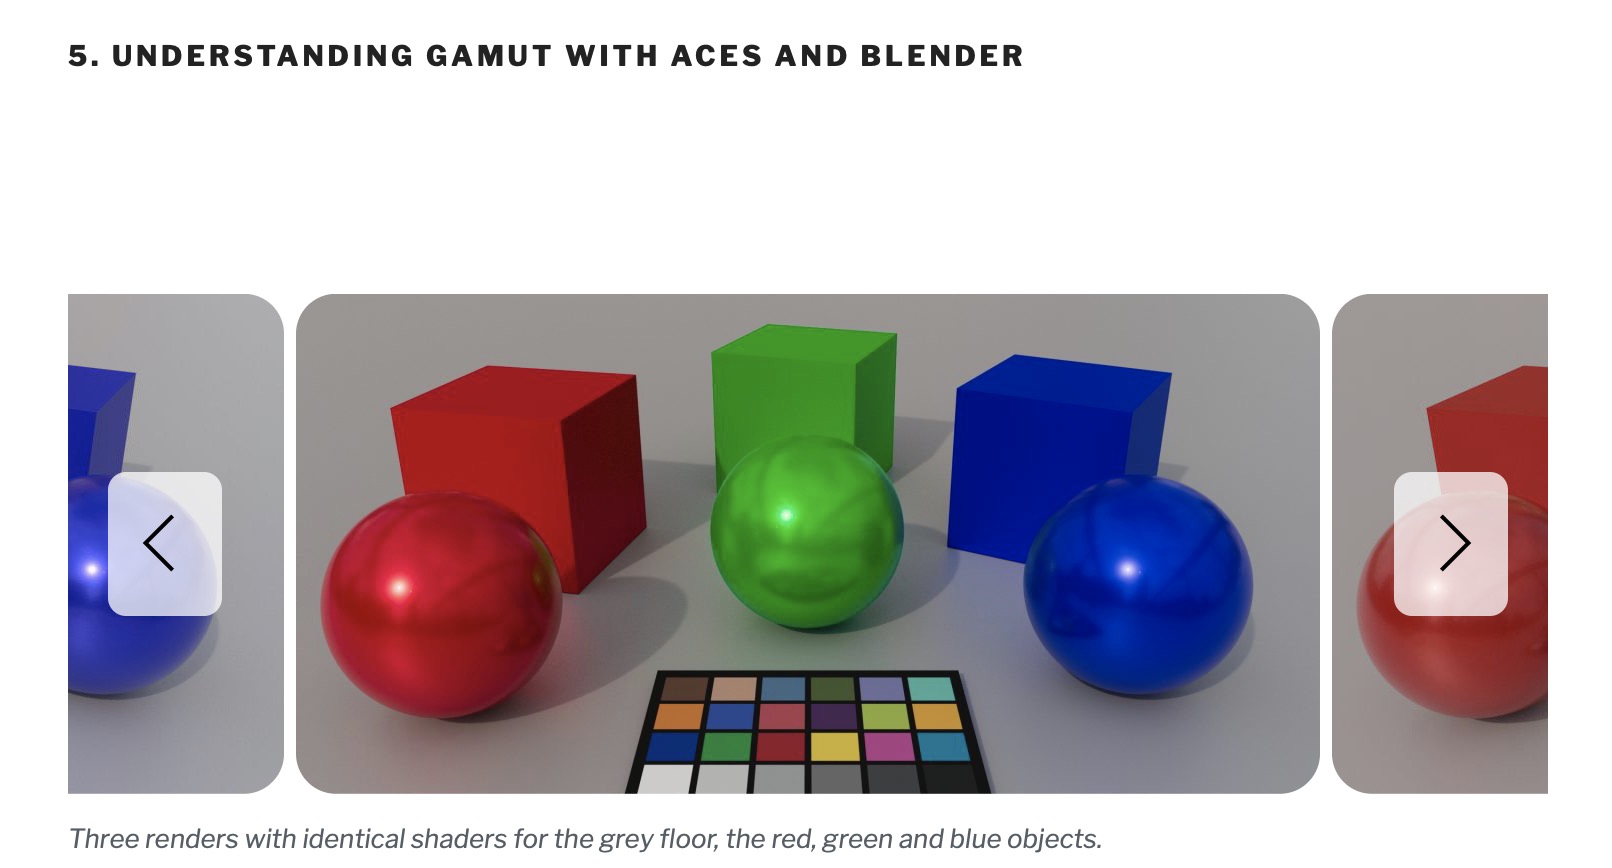
There I was setting up the ACES workflow together with Sönke Heuer (Colorist, also present here on ACESCentral) for the company. At the moment we use ACES (not on every project) with Resolve, Maya, Nuke, Flame and a bit of Photoshop.
For testing purposes I also use Blender 2.8 Beta (with OCIO environment) and Affinity Photo.
I wrote until now 5 articles about ACES on my website.
When I posted my last one I was asked to post it also here.
I am writing these article to share knowledge internally in the company and also externally.
I find them also useful at times as a reference for myself after a while.
I am looking forward for feedback, ideas and pointing out mistakes as the topic is not that easy.
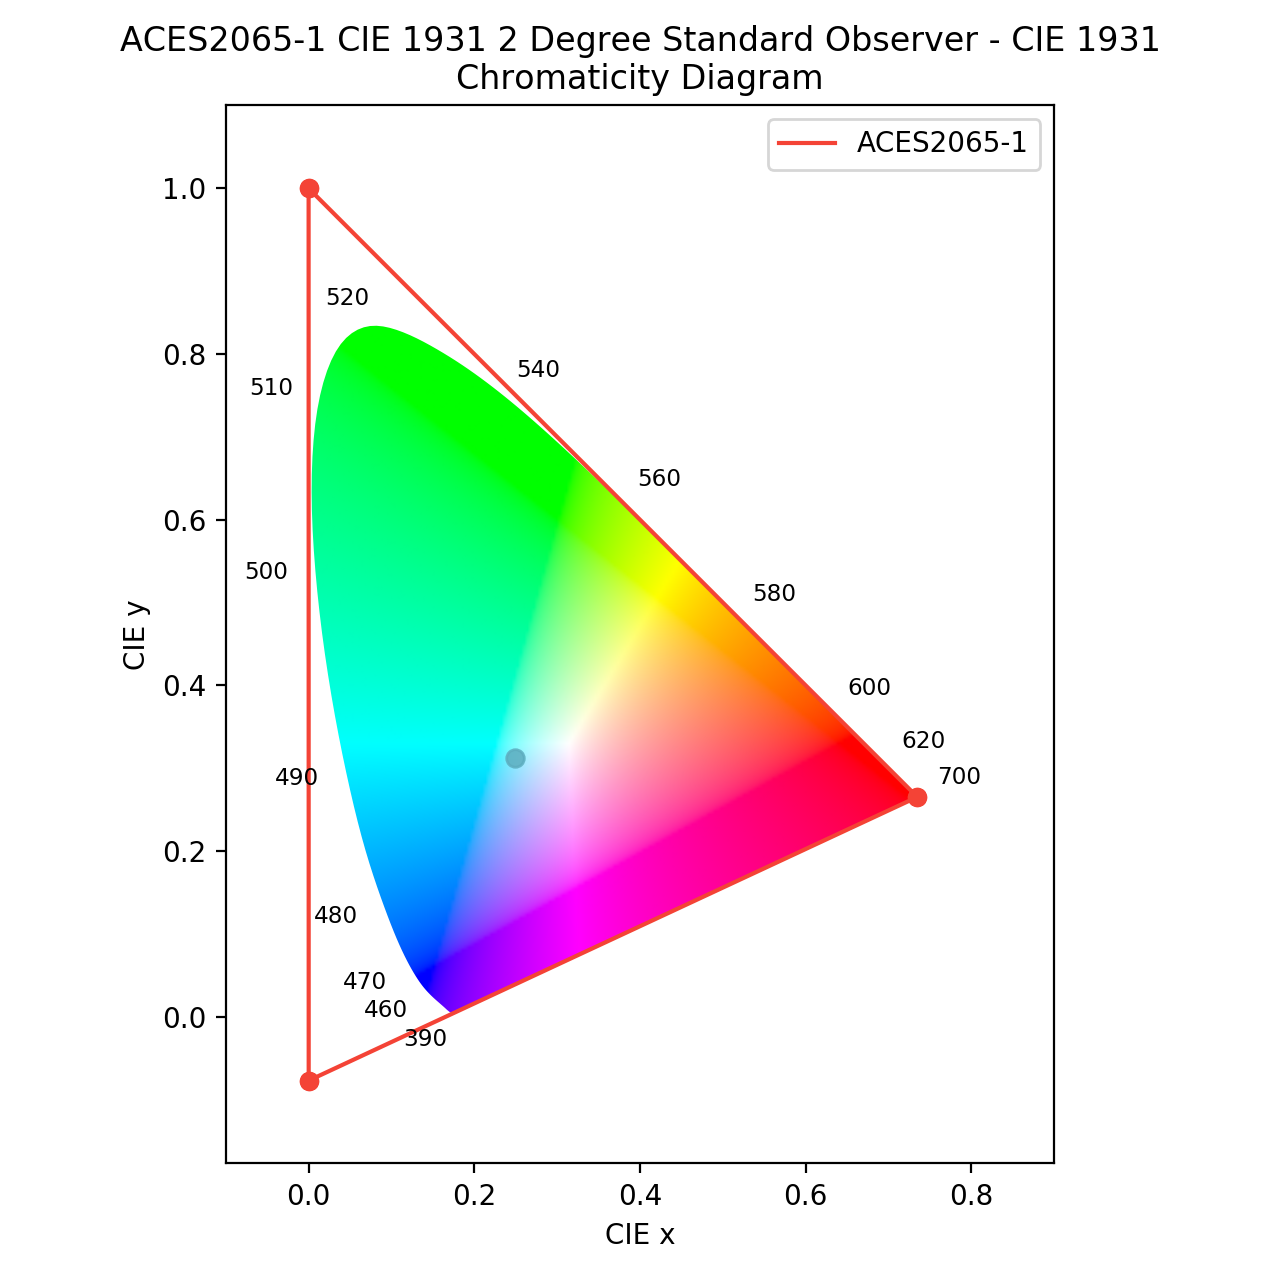
Acutally I am looking for help how to plot a specific color value in the CIE diagram with the help of https://www.colour-science.org. I don’t get it to work. Thanks.
Hi Nick Shaw,
thanks for your help.
After some troubles I got the new Colour 0.3.12 running.
Now I need to think about and understand how to plot colors that are out of gamut
(Rec.709), but inside ACEScg.
You can show other gamuts on the plot using the colourspaces kwarg with a list of colourspaces. e.g. >>> plot_RGB_chromaticities_in_chromaticity_diagram_CIE1931(RGB, colourspace='ACEScg', colourspaces=['ITU-R BT.709'], show_spectral_locus=False, show_whitepoints=False)
However, what you need to ask yourself is what you are trying to illustrate. ACEScg is a scene-referred colour space, and although per-spec Rec. 709 is a scene-referred camera encoding, when we say “Rec. 709” we frequently mean “BT.1886”, as in the ACES Rec. 709 ODT. In that case it is an output-referred colour space, and there is not a direct correlation between the chromaticities of the ACEScg pixel values, and those of the same pixels on a “Rec. 709” display, as they are re-mapped by the ACES RRT and ODT.
Hi Nick,
thanks for taking time again and for the help.
I added a small part on that page (also with a link to the page on ACESCentral) where I put a plot of a red color that is outside Rec.709 but inside Rec.2020 (together with ACEScg).
I tried to summarize the hint that you gave me without going even more into detail as you did.
Do you mind if I mention you directly or is a link to the page here more than enough?
I’m fine with the note and link you’ve included, but whatever you want to put is ok by me.
One small correction to your note. Scene-referred does not have to mean linear. Log encodings have a documented mathematical relationship with relative scene light, so are still scene-referred. ACEScc and ACEScct are scene referred too; not just ACES2065-1 and ACEScg.